Preventing application outages or significantly reducing mean-time-to-resolution (MTTR) after an application outage are shared goals across any organization. However, there has long been a blind spot between cloud networking and cloud ops, and application development and DevOps teams.
The tension stems from both sides. For cloud teams, visibility into network performance and security is complex enough to achieve, let alone share effectively with the development side of the house. Cloud service providers (CSPs) and even third-party cloud networking solutions can be black boxes. Multicloud strategies and hybrid environments have further created visibility gaps, inconsistent metrics, and complex network paths, complicating network monitoring efforts.
For DevOps teams, the lack of line of sight between layer 3 and layer 7 is a challenge that needs to be solved – but not by adding more tools. According to recent research from Dynatrace, organizations already use 10 different monitoring and observability tools on average to manage applications, infrastructure, and user experience. The fact that the network remains a blind spot naturally leads to a tendency to “blame the network” when there’s an issue.
Importance of Visibility at the Network Layer
The solution to this communication gap is a shared means of visibility into the network layer, delivered within the existing tools and framework already in use by DevOps teams.
Organizations need a way to collect cloud networking details that the CSPs and other vendors don’t expose – many of which are of significant value to application development and DevOps. Furthermore, they need these metrics delivered through a “single pane of glass” so they can be consumed where they can add the most value – inside application observability tools.
Access to these details proactively enable huge “aha” moments that today are only found during a crisis through massive MTTR digs in high stress war rooms.
More than Uptime: The Benefits of MTTR Reduction
While application availability and reduced downtime are among the most visible and immediate benefits, MTTR reduction gives businesses several advantages.
First, a reduction in MTTR helps maintain compliance with service level agreements (SLAs), certain regulations such as SOC2, or other policies. This compliance helps the business avoid penalties. It is also important for sustaining customer and partner relationships. Businesses have an opportunity to enhance their reputation though decreasing downtime, growing their reputation for reliability.
Beyond reputation and compliance benefits, decreased downtime has a direct impact on the bottom line. According to recent research, the average business can expect a downtime cost of $5,600 per minute (GlobalDots). Some industries like retail can skew much higher. Another report found retailers reported a median annual outage cost of $9.95 million (New Relic).
Reduced MTTR also frees up IT resources to focus on more strategic business initiatives. As companies struggle with IT skills gaps and overstretched employees, taking the volume of unplanned work (like downtime diagnosis) off IT teams’ shoulders is vital for productivity and employee satisfaction.
Anecdotally, proving you have proper monitoring and verification in place can grease the skids for other operational changes. For example, can your team have smaller change windows if they’re better able to troubleshoot and fix issues fast? Risk calculations can be complex, but it’s worth considering or asking engineering teams how much time they would save if you could cut their troubleshooting time down by 30%.
Harness the Power of Cloud Telemetry: Introducing Aviatrix Network Insights API
In today’s cloud-centric world, visibility into network performance and security is vital for any organization striving to maintain operational excellence. The Aviatrix Network Insights API is your gateway to unlocking a wealth of telemetry data. It empowers your business to make informed, data-driven decisions.
The Aviatrix Network Insights API is not just a tool—it’s the solution to complex cloud networking challenges. By offering direct API access to advanced telemetry from the robust Aviatrix Cloud Networking Platform, you gain unparalleled insights into your network’s health and performance. This data is critical for professionals in cloud networking, security, and operations. They demand a centralized, integrated approach to managing their cloud environments.
Advanced Telemetry at Your Fingertips
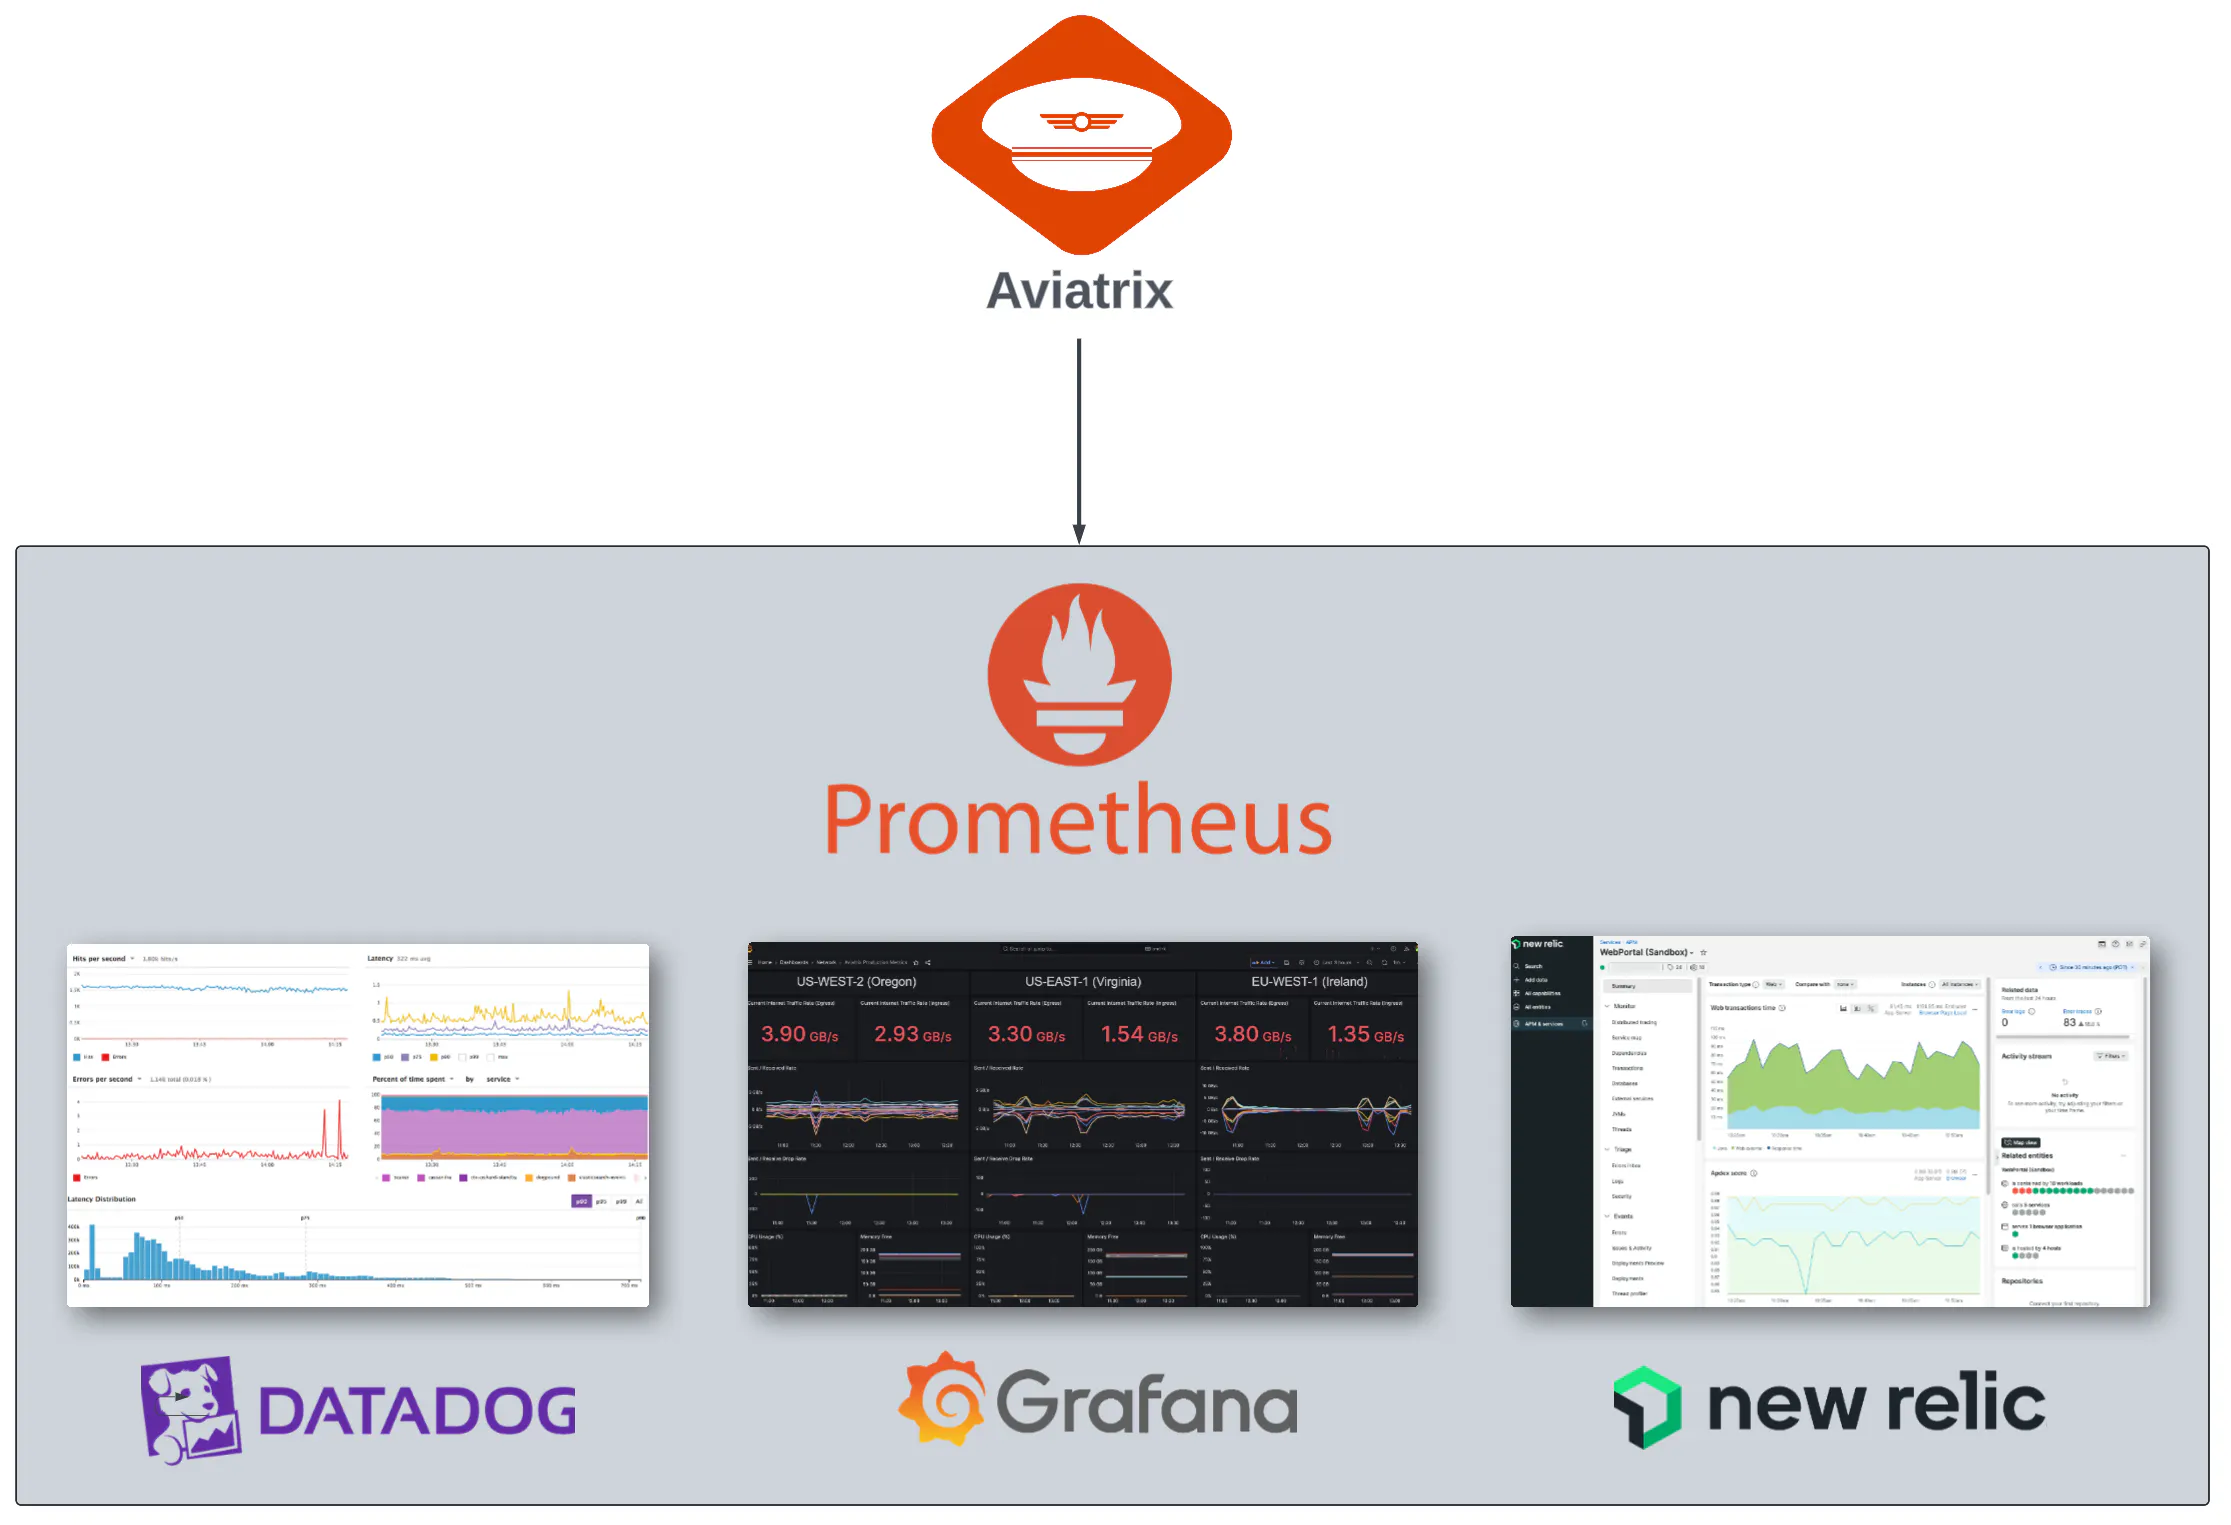
Imagine having a comprehensive view of your network’s status. Get detailed statistics on network interfaces, the health of Aviatrix micro-gateways, and resource utilization—all available through a simple API call. Our Network Insights API streamlines the integration with top-tier analytics and visualization platforms like Datadog, Grafana, and Splunk, enabling you to enhance operational efficiency, ensure regulatory compliance, and gain insights into the performance of your business-critical applications.

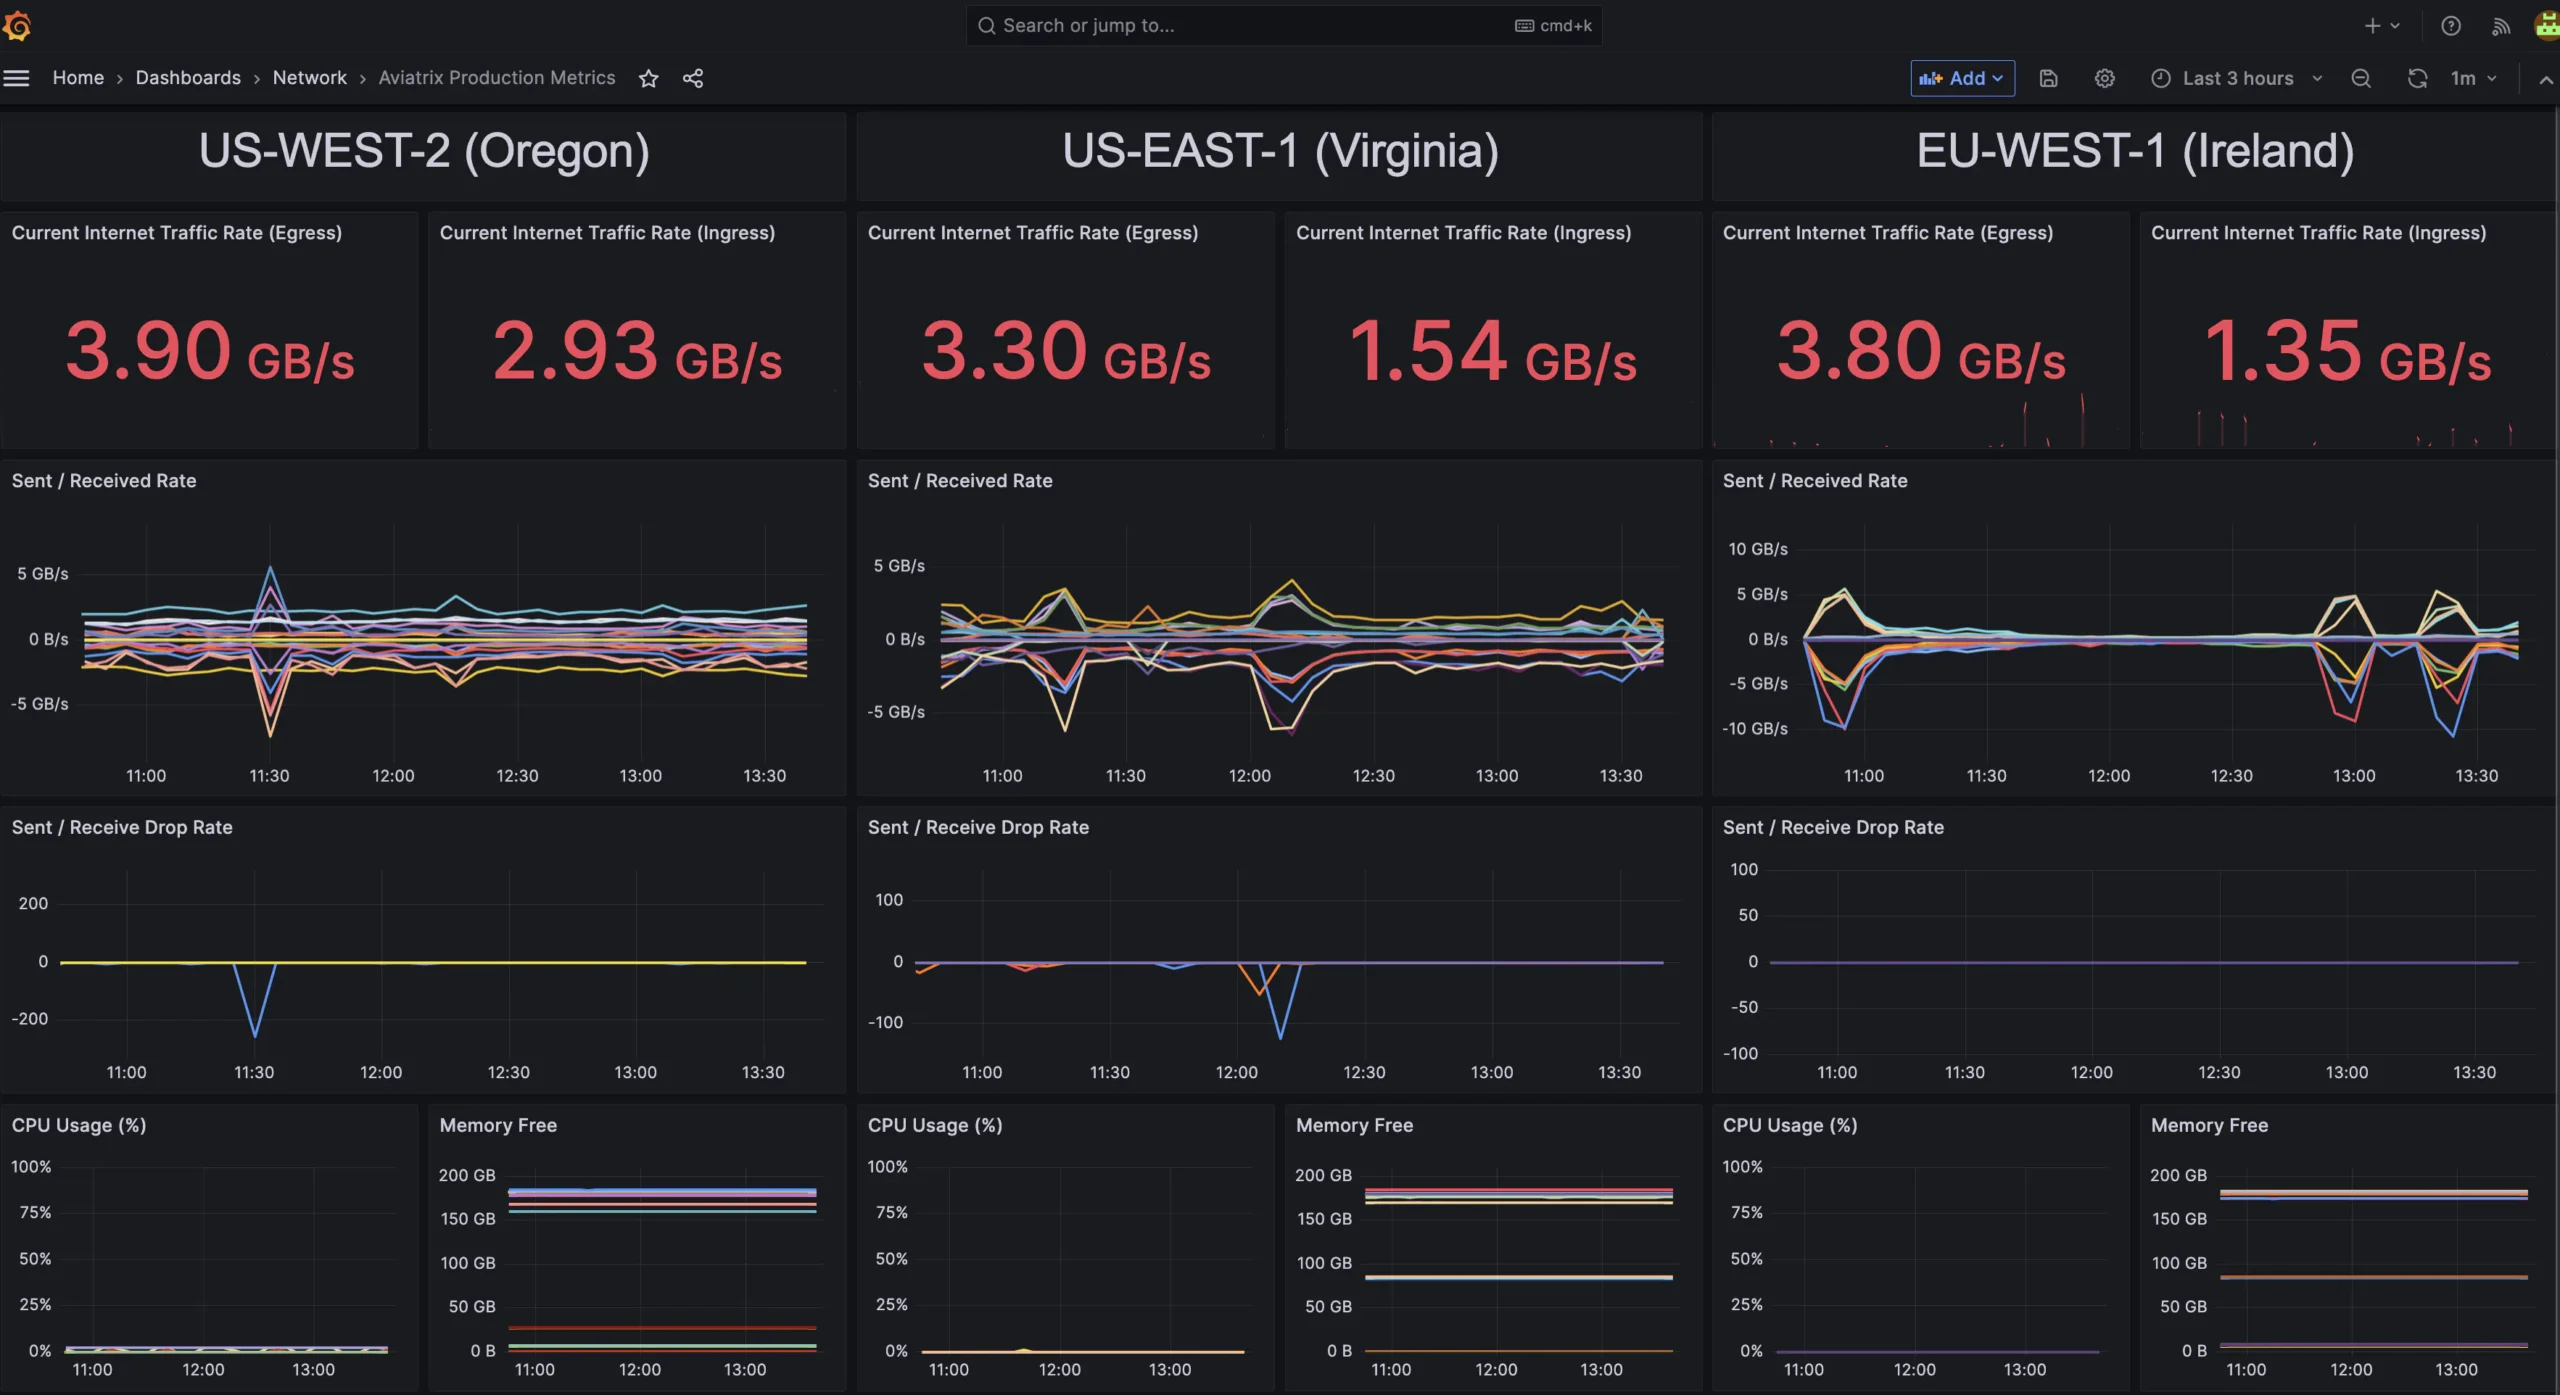
Real world example of a customer integration between Aviatrix’ Network Insights API and Grafana
Here are some of the key benefits you can expect when using the Aviatrix Network Insights API:
API Access: Tap into advanced network and security telemetry that you can’t get from cloud providers’ native tools.
Seamless Integration: Easily connect with leading analytics and visualization solutions to make the most out of your data.
Operational Efficiency: Streamline cloud operations with actionable insights that help you respond rapidly to changes and challenges.
Regulatory Compliance: Maintain a strong compliance posture with detailed, timestamped records of network activity.
Performance Insights: Dive deep into your cloud network’s performance to ensure your applications run smoothly and reliably.
Powered by industry-standard Prometheus, the Aviatrix platform meticulously collects and stores time-series data, including metrics and statuses. This information is timestamped and made accessible through the Network Insights API or via JSON formatted exports. Whether you’re monitoring traffic patterns or tracking down potential security incidents, Aviatrix provides the real-time data you need to stay ahead.

Begin Transforming Your Business
In the age of the cloud, data is king. With Aviatrix Network Insights API, you’re not just collecting data—you’re unlocking its potential to transform your business. If you’re ready to take your cloud network operations to the next level, visit the Aviatrix website today or get in touch and discover how the power of the right insights can set you apart from the competition.
Getting started with Network Insights API is simple through Aviatrix CoPilot, which is available in the AWS Marketplace, Azure Marketplace, Google Cloud Marketplace, and Oracle Cloud Marketplace. Subscribing to CoPilot grants rights to the new Network Insights API. Cloud administrators and IT leaders can easily integrate this tool into their cloud environments to export and visualize network data with their chosen analytics platforms.


